Group Snapshot:
Amit Sharma (10510235)
Md. Zeeshan Rafi (10512770)
Debi Prasad Das (10515388)
When it comes to business and big data, more isn’t always better. This is because raw data, when captured and stored in data silos, isn’t valuable unless it’s being broken down, evaluated, and acted upon. It’s been suggested that as little as 1% of the world’s data is effectively analyzed, with the rest either being captured and held indefinitely or never captured at all. And as the amount of data being created on a daily basis grows from year to year, ever more valuable information is slipping through the cracks. However, perhaps even more troublesome is when data is properly analyzed, and nonetheless still goes to waste. Bad data, which is to say data that is either inaccurate or incorrectly analyzed, has been shown to cost businesses as much as 25% of their revenue in certain situations.But it doesn’t have to be this way. Often, getting the most out of analyzed data is simply a matter of understanding data visualization. This is assignment for us is a small attempt to enhance, increase and present our skillset and expertise in interactive data visualisation
For the exploration of interactive visualization, we have selected the Rain in Australia dataset which can be downloaded by this link.
Predict whether or not it will rain tomorrow by training a binary classification model on target RainTomorrow
This dataset contains daily weather observations from numerous Australian weather stations.The target variable RainTomorrow means: Did it rain the next day? Yes or No.
Date - The date of observation.
Location - The common name of the location of the weather station.
MinTemp - The minimum temperature in degrees celsius.
MaxTemp - The maximum temperature in degrees celsius.
Rainfall - The amount of rainfall recorded for the day in mm.
Evaporation - The so-called Class A pan evaporation (mm) in the 24 hours to 9am.
Sunshine - The number of hours of bright sunshine in the day.
WindGustDir - The direction of the strongest wind gust in the 24 hours to midnight.
WindGustSpeed - The speed (km/h) of the strongest wind gust in the 24 hours to midnight.
WindDir9am - Direction of the wind at 9am.
WindDir3pm - Direction of the wind at 3pm.
WindSpeed9am - Wind speed (km/hr) averaged over 10 minutes prior to 9am.
WindSpeed3pm - Wind speed (km/hr) averaged over 10 minutes prior to 3pm.
Humidity9am - Humidity (percent) at 9am.
Humidity3pm - Humidity (percent) at 3pm.
Pressure9am - Atmospheric pressure (hpa) reduced to mean sea level at 9am.
Pressure3pm - Atmospheric pressure (hpa) reduced to mean sea level at 3pm.
Cloud9am - Fraction of sky obscured by cloud at 9am. This is measured in "oktas", which are a unit of eigths. It records how many eigths of the sky are obscured by cloud. A 0 measure indicates completely clear sky whilst an 8 indicates that it is completely overcast.
Cloud3pm - Fraction of sky obscured by cloud (in "oktas": eighths) at 3pm. See Cload9am for a description of the values.
Temp9am - Temperature (degrees C) at 9am.
Temp3pm - Temperature (degrees C) at 3pm.
RainToday - Boolean: 1 if precipitation (mm) in the 24 hours to 9am exceeds 1mm, otherwise 0.
RISK_MM - The amount of next day rain in mm. Used to create response variable RainTomorrow. A kind of measure of the "risk".
RainTomorrow - The target variable. Did it rain tomorrow?
For this assignment we have used python programing. For better visualisations we have also used libraries such as; bokeh, matplot, plotly, altair. For density graph we have used R programming.
The 1st interactive visualisation was created in form a bokeh plot which outputs an html file. Please click on the below image to open the html file.
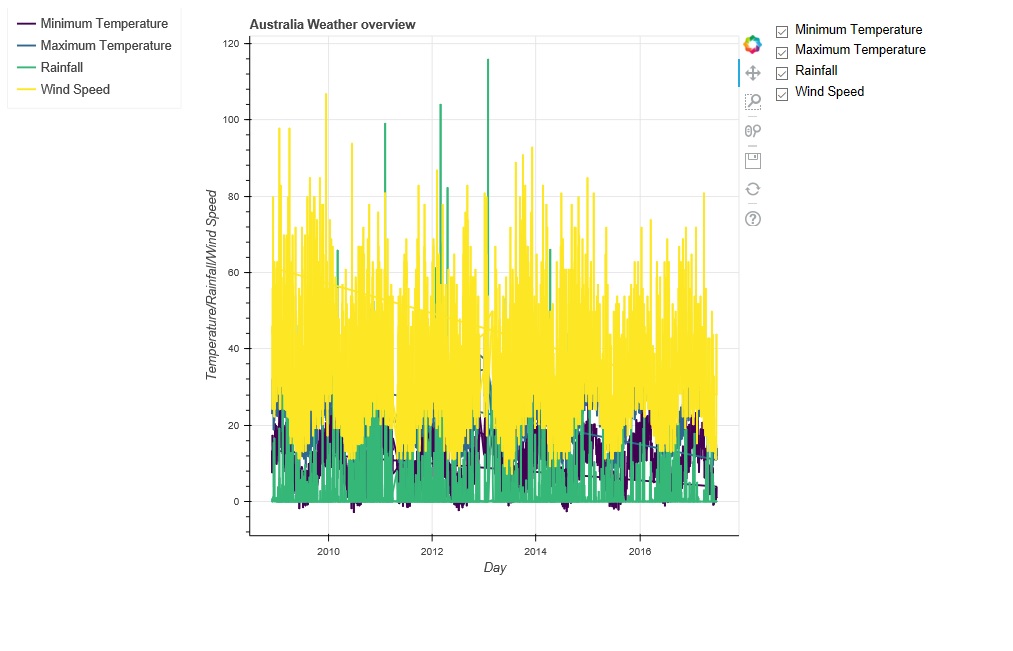
This graph displays the variation in weather parameters such as; minimum and maximum temperature of the day, Rainfall and windspeed. It is observed that minimum temperature varies approximately between 0 to 20 while maximum temperature varies between 20 - 40 each year. Hence it can be concluded that temperature is almost consistent across the years.
Furthermore, rainfall is recorded to be the highest in 2013 and lowest before 2010 and after 2016.Windspeed is varying between 10 - 60 across the year while it was recorded to be the highest in 2010.
The 2nd visualisation is an interactive scatter plot showing the weather type for each location when mouse is scrolled over a dot. Click on the below image to view the interactive visualisation.

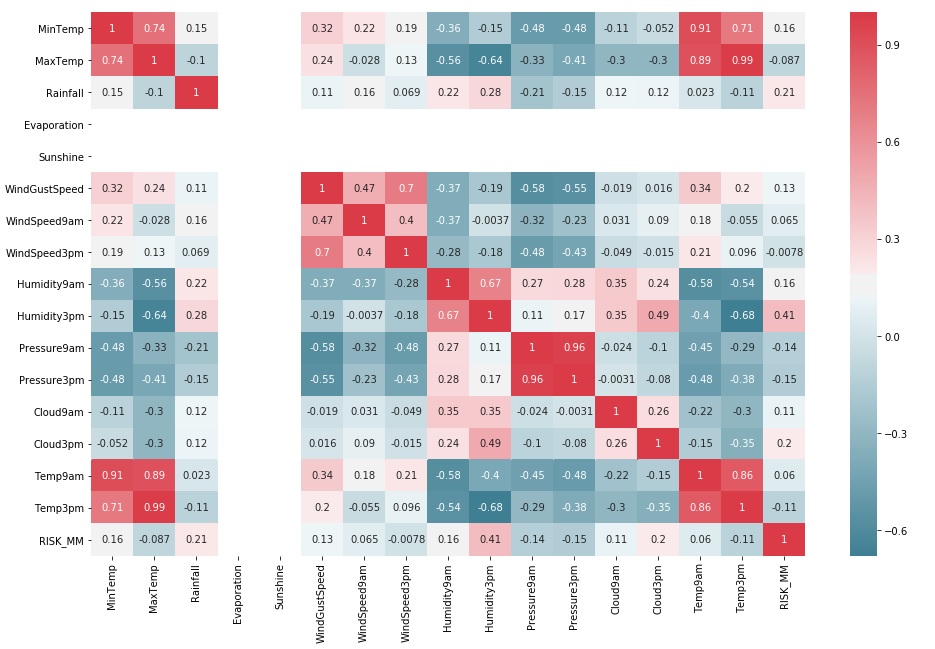
The below is a heatmap produced with all the factors those put an effect/impact on weather and the measure over a period of time for better analysis.
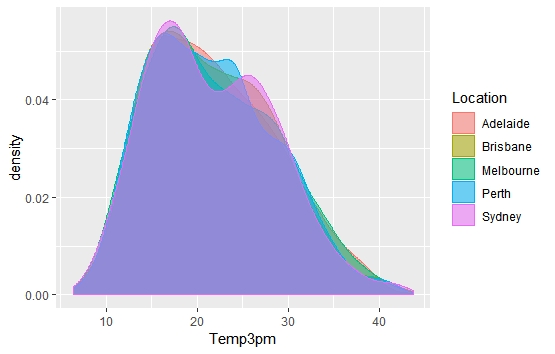
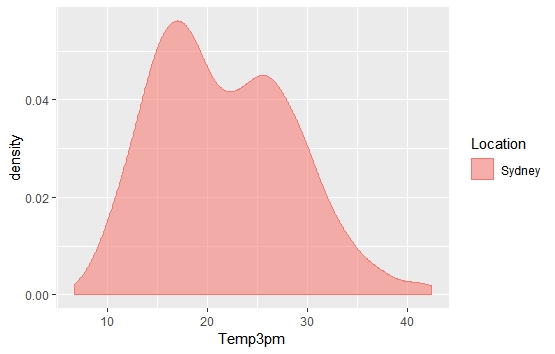
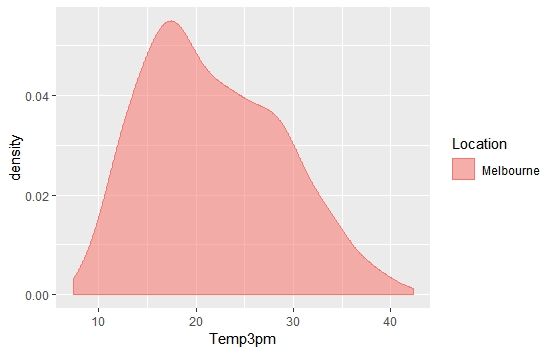
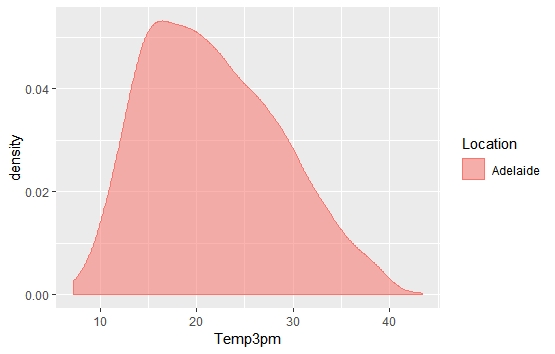
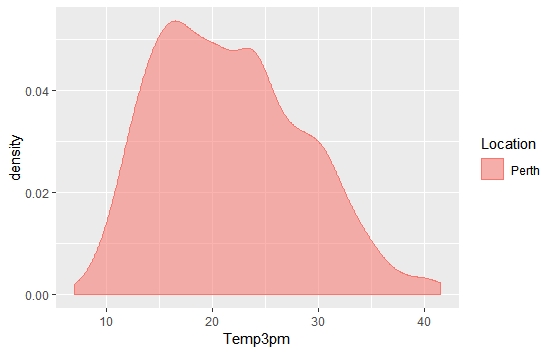
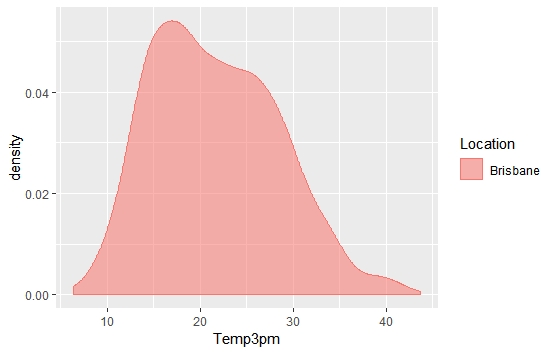
The below visualisation is a density graph of rainfall across Australia. This plot was produced in R to have a 3-D like visualisation for better accumulation.

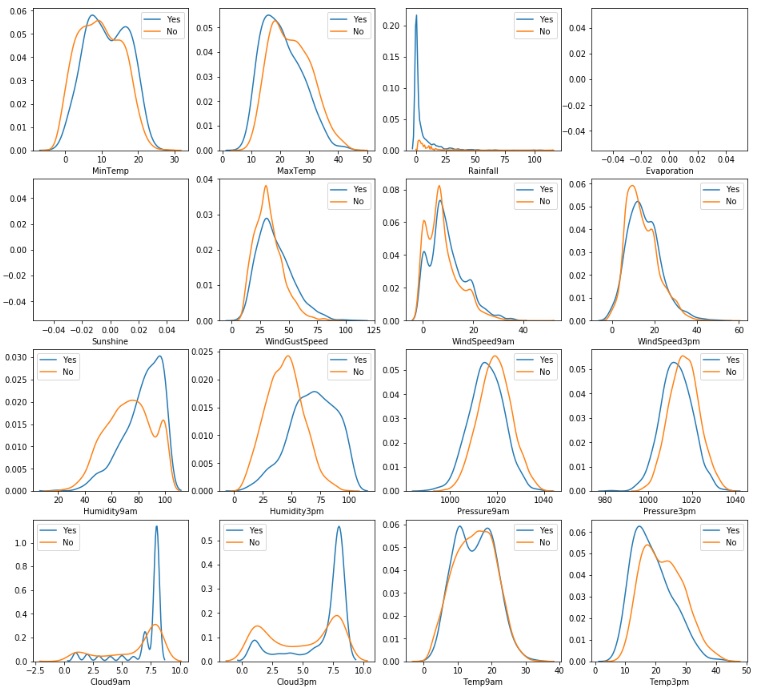
This is the final visualisation to predict whether people need an umbrella tomorrow or not. Below is the visualisation to explain the same.
As it was a group assignment and not individual assignment, all the group members worked hard together right from selecting the dataset to deploying the application github and create the webpage, and there was an equal contribution from every single member of the team. Tasks such as; dataset selection, data preparation, creating different visualisations and building the webpage etc. were divided individually and handled to reach the timeline and goal of the assignment. There were multiple meetings and discussions conducted to reach on a decision as a group/team.
The whole development process including the webpage creation took us around 50 people hours including the meetings, discussions and research on coding practice and learning different tools and libraries. Getting on to a team approach was the most crucial and critical approach which took the measurable time along with the visualisations which were made interactive (Especially Visualisation 1 as it was an highly interactive plot in an html file).
By having this assignment we not only got to learn data visualisation but also how to work in a team where we can get a lot of agreement/disagreement/opinions/concerns/challenges and overcome those with our team’s support.